Kris Bryant’s Stats Nearly Identical to Last Year
Let’s just go ahead and get this out of way early: Yes, I realize a comparison of stats from 26 games to those from 155 is more than a little frivolous. But when you look across the numbers Kris Bryant has posted and you see the uncanny similarity, it’s too fun not to at least give a little side-eye action.
My favorite part of all this is how he keeps providing very definitive answers to the questions brought up by the various tiers of his slow start. When Bryant went 0-for-14 to set a record for futility when it came to MVPs opening their follow-up season, people wondered whether the pressure to live up to the hype might be getting to him. So he went eight for his next 12 to shut that talk down.
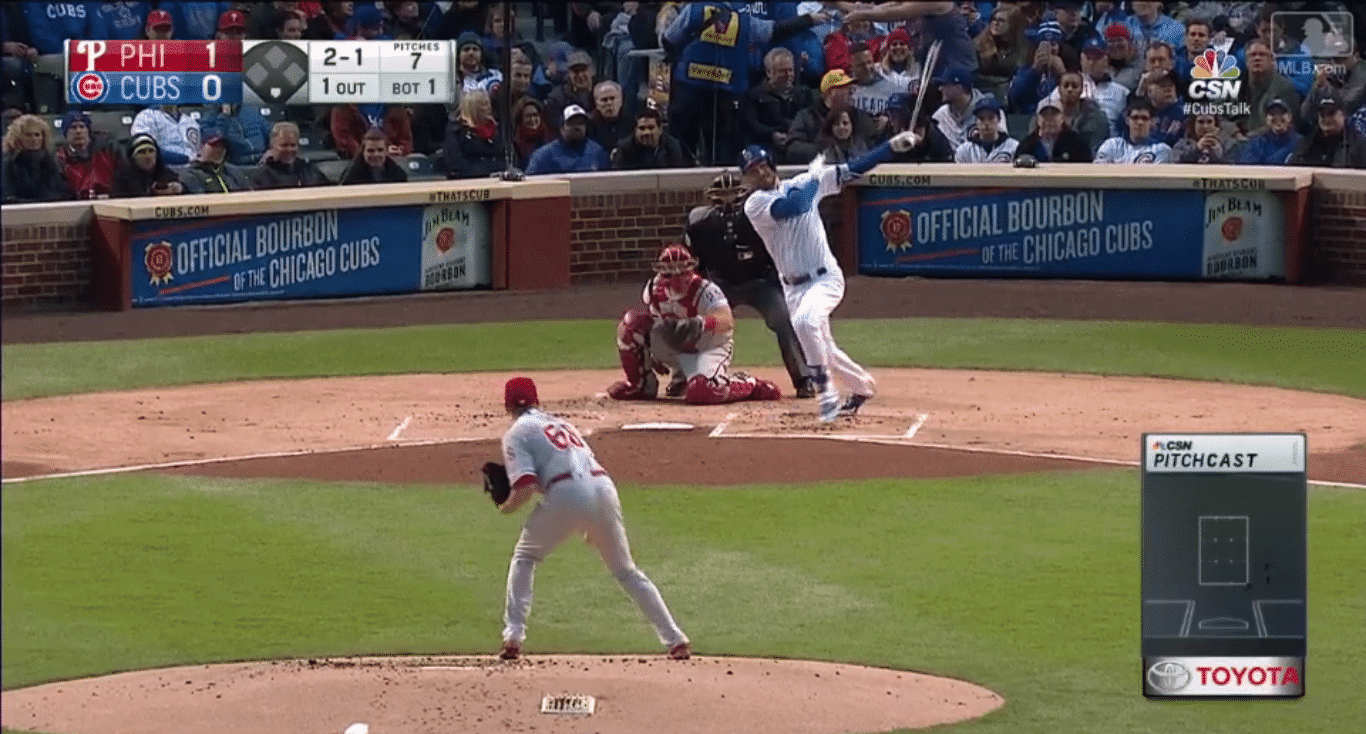
But with only two home runs through 21 games, you started to see folks expressing worry over his power numbers, or lack thereof. If two homers over the weekend in Boston were a soft lullaby to put those fears to bed, his laser shot Tuesday night was Samuel L. Jackson reading them “Go the F*** to Sleep.” It also pulled Bryant right in line with last year’s award-winning numbers.
Raw power is measured by ISO, a metric that tells us how often a batter hits for extra bases. League-average ISO both this season and in 2016 was .162 and Fangraphs tells us that anything above .250 is excellent. Bryant’s .262 last season was higher than all but 10 players in baseball, which means he displayed elite power. Not that you didn’t already know that, but I’m trying to drive the point home.
Without looking, anyone wanna venture a guess at this season’s ISO? If you guessed .262, you’re right. While there are some freakish performances pushing Bryant further down the list (29th, to be exact) here in early May, the point is that his baseline power numbers are identical to those he posted last year. But that’s not all.
Underpinning the moderately serious nail-biting in regard to Bryant’s early performance was the renewed propensity to swing and miss. That’s a pretty valid fear, as it’s a part of his game that has always scared people. I have never paid heed to the caveats therein myself, but they’re impossible to avoid. In any case, a big part of last season’s ringing success was a strikeout rate that dropped to 22.0 percent from 32.4 as a rookie.
Time for another guessing game: What’s KB’s K-rate this season? Close, it’s actually 22.1 percent, or pretty much identical to 2016.
Okay, enough with the little nibbles, let’s tear off a couple big chunks. Last year saw Bryant slash .292/.385/.554 with a 149 wRC+ and .396 wOBA; this year he’s at .291/.393/.553. with a 148 wRC+ and .402 wOBA. Yet again, we’re basically looking at mirror images.
The one area in which we see a significant difference in Bryant’s walk rate, which is up to 13.9 percent from 10.7 percent last season. Hence the year-over-year increases in OBP and wOBA. Given that his 2017 results are entirely sustainable, that increased patience should really add up over the course of the year and should help to bring Bryant’s WAR totals back in line with last season. With only 1.2 WAR through 26 games thus far, he’s on pace for a mere 7.1 wins over 155 games.
I know, right? What a disappointment, geez.
The best part of all this is that Bryant’s numbers are offset by that early mini-slump and the general dearth of power through the first two thirds of April. He’ll have more little cold spots throughout the year, to be sure, but continuing along the trend he’s set over the last couple weeks should see him surpassing the numbers that earned him the NL MVP.
That’ll definitely be the case if pitchers keep stupidly trying to throw him inside. Wait, what I meant to say was that Bryant is really susceptible to inside stuff and that pitchers should keep trying to bust him on the hands. Yeah, that’s it. You’re welcome, NL pitchers.

