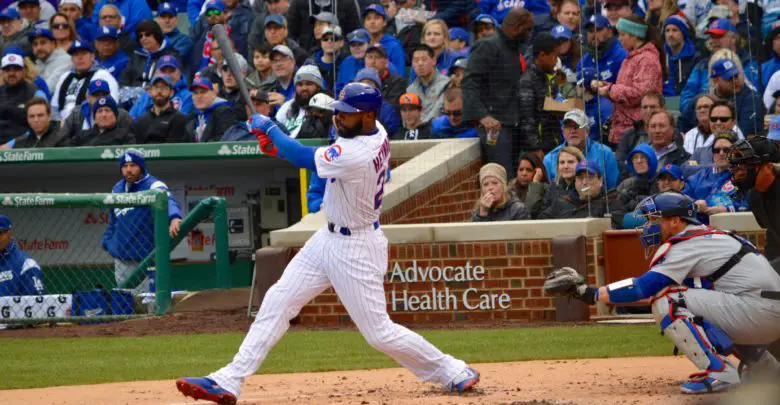
Willson Contreras Leads Team in Exit Velocity Improvement, Followed Closely by Jason Heyward
We’ve reached a few meaningful points in the season even though it’s only mid-April. For instance, plate discipline metrics are somewhat reliable now. And even more tantalizing, so too is exit velocity. It takes about 50 plate appearances for exit velocity to be more attributable to the player and not just randomness.
Here are the early season improvers in exit velocity for Cubs batters:
| Player | 2017 EV | 2018 EV | Difference |
| Willson Contreras | 86.9 | 95.8 | 8.9 |
| Jason Heyward | 84.4 | 91.4 | 7.0 |
| Kris Bryant | 87.0 | 89.9 | 2.9 |
| Javy Baez | 86.5 | 89.0 | 2.5 |
| Ben Zobrist | 86.5 | 88.3 | 1.8 |
| Anthony Rizzo | 88.3 | 90.0 | 1.7 |
| Kyle Schwarber | 88.6 | 89.7 | 1.1 |
| Addison Russell | 87.7 | 87.0 | -0.7 |
| Ian Happ | 88.4 | 86.9 | -1.5 |
| Albert Almora | 86.4 | 83.8 | -2.6 |
Willson Contreras has improved his exit velo the most, sporting a robust 8.9 MPH difference compared to last season. In fact, Willie’s 95.8 MPH average is 3rd best in MLB (60 PA minimum).
Jason Heyward’s exit velocity has jumped 7 MPH from last season. This is a good time to point out the dangers of just focusing on exit velocity. Heyward’s “dribbler” exit velocity has also jumped 7 MPH from last season, and the his pop-up rate has doubled compared to last season. While the spike in exit velocity for Heyward is mildly optimistic, we need to take these considerations into thought. After all, he still has only a .316 expected weighted on-base average (xStats). It’s not all about exit velocity.
Nevertheless, exit velocity is still informative when carefully considered. Take Kris Bryant and Ben Zobrist as an example. Every time I watch KB or Zo at the dish, they seem to be smacking pitches hard, so it’s not surprising to see their exit velocities are two and three MPH higher, respectively. Likewise, Ian Happ has been struggling mightily at the plate, which is partially reflected by a 1.5 MPH dip in exit velocity.

