
CI Exclusive: Study Shows Cubs Produce MLB’s Worst ROI Based on Game Action for Ticket Cost
Fresh topics are kind of hard to come by these days, particularly when you’re trying to maintain a weekly Quantifying Hope column that focuses on the Cubs’ odds and other measurements of their performance. So you can imagine my relief excitement when the folks at Casino.ca came to CI with an exclusive study about ticket ROI for the Cubs and MLB overall.
Gone are the days of kids getting free bleacher tickets to the next day’s game for picking up trash and flipping up seats. The Cubs boast some of the highest ticket prices in the league and they easily lead the majors when it comes to fan cost index, an approximation of what it costs to take a family of four to the ballpark. But are Cubs fans really getting a commensurate bang for their big bucks?
Not even close, the study found.
The Cubs may not have the least exciting games, but they’re in the bottom third of the league when it comes to providing action. The first chart below shows that the Cubs have action in a little less than 9% of their game minutes, the second breaks it down further by specific types of action. You may notice something about the date range in question, so let’s talk about that on the other side.
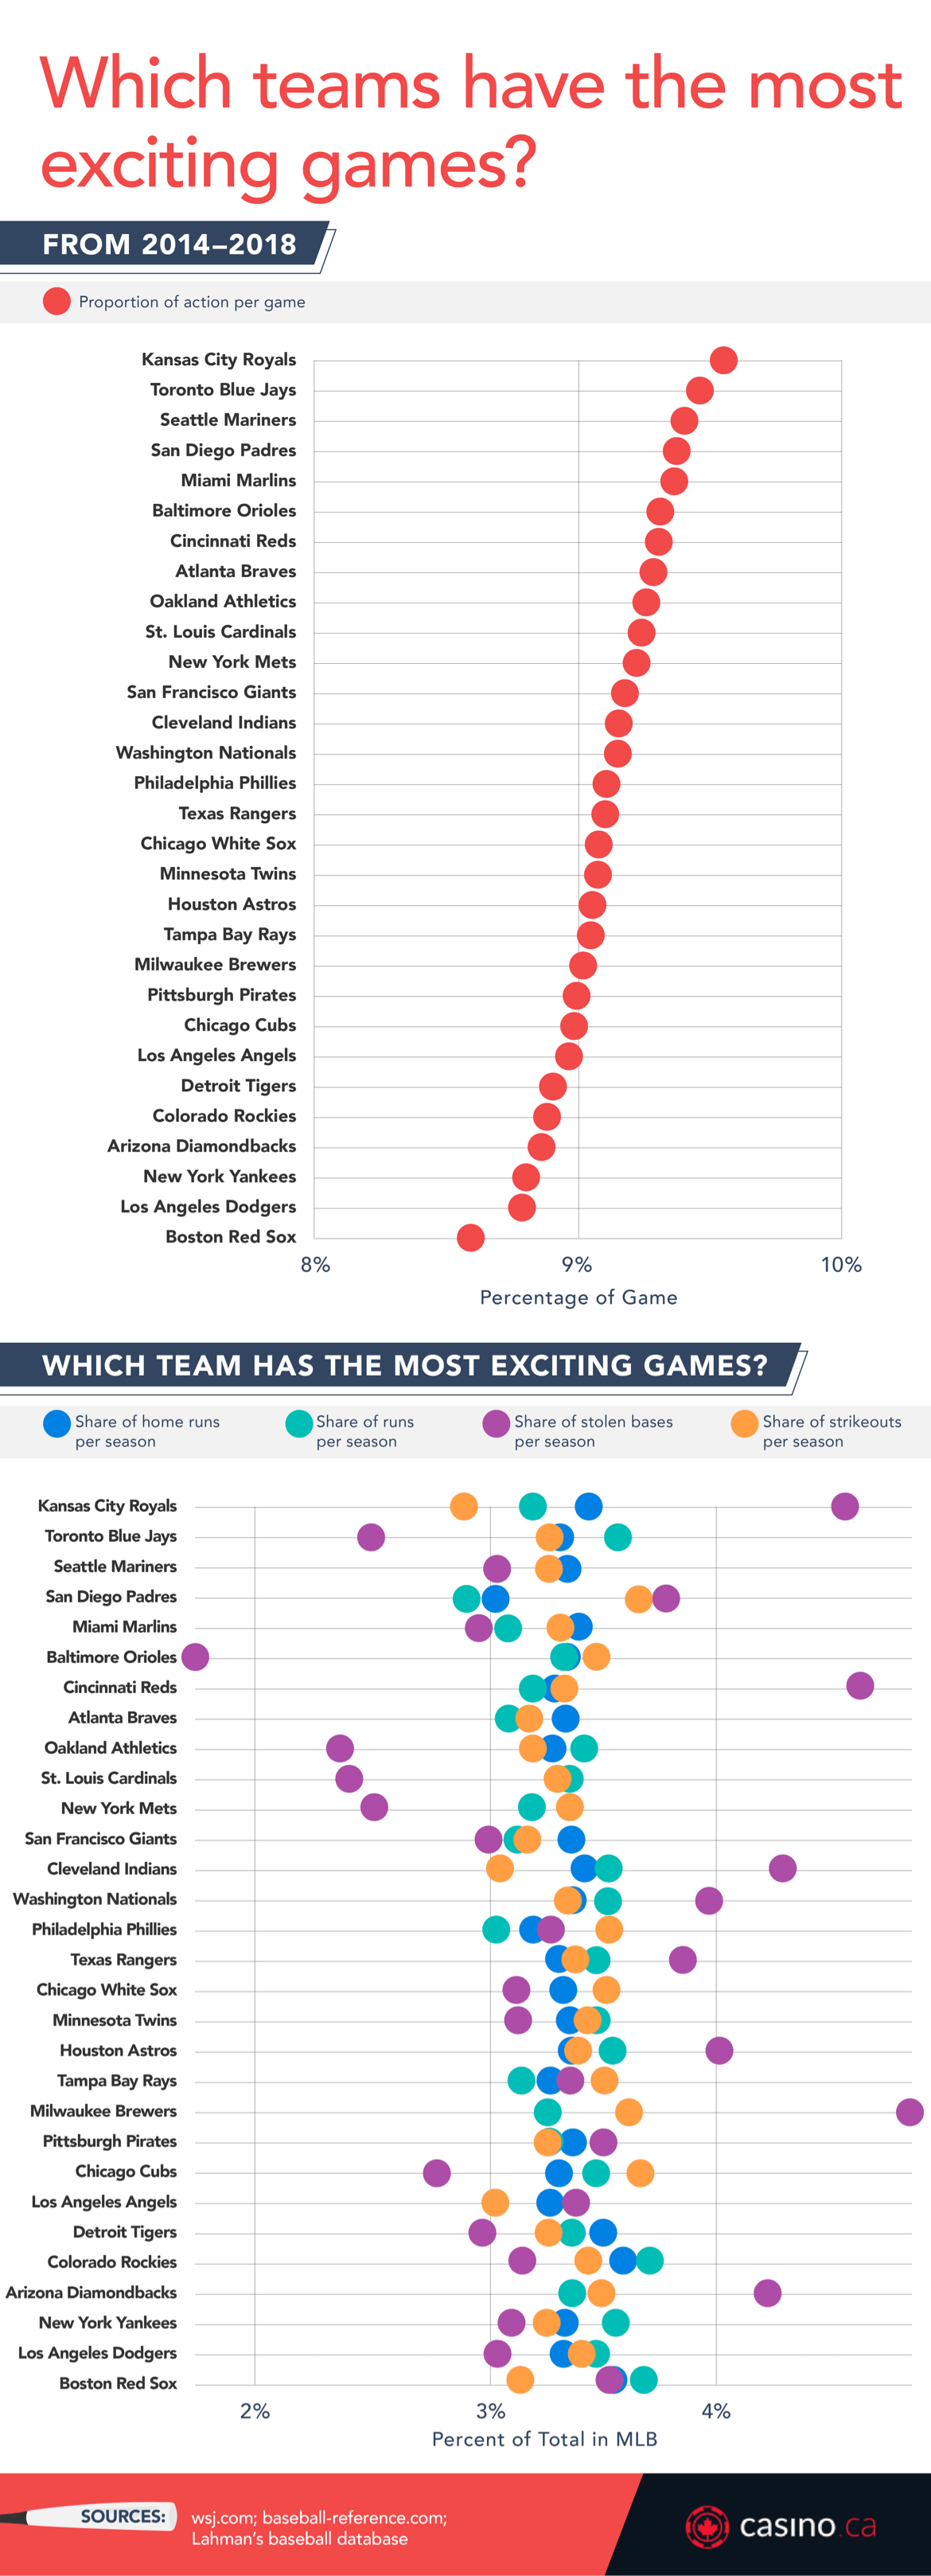
The five-year period being used to calculate these figures runs from 2014-18, the first of which isn’t necessarily the best example of good baseball on the North Side. Ricky Renteria’s ill-fated rookie campaign resulted in a 73-89 record for a team that was never supposed to win, ushering in the Joe Maddon Era that turned out three consecutive NLCS berths starting the very next year.
To be fair, though, the ’14 season really wasn’t any worse than what we all suffered through in 2019. I mean, sure, the Cubs were above .500 last season and had the talent to be much better, but Maddon was a lame duck and the team faltering in the face of solid expectations was most definitely not worth the price of admission.
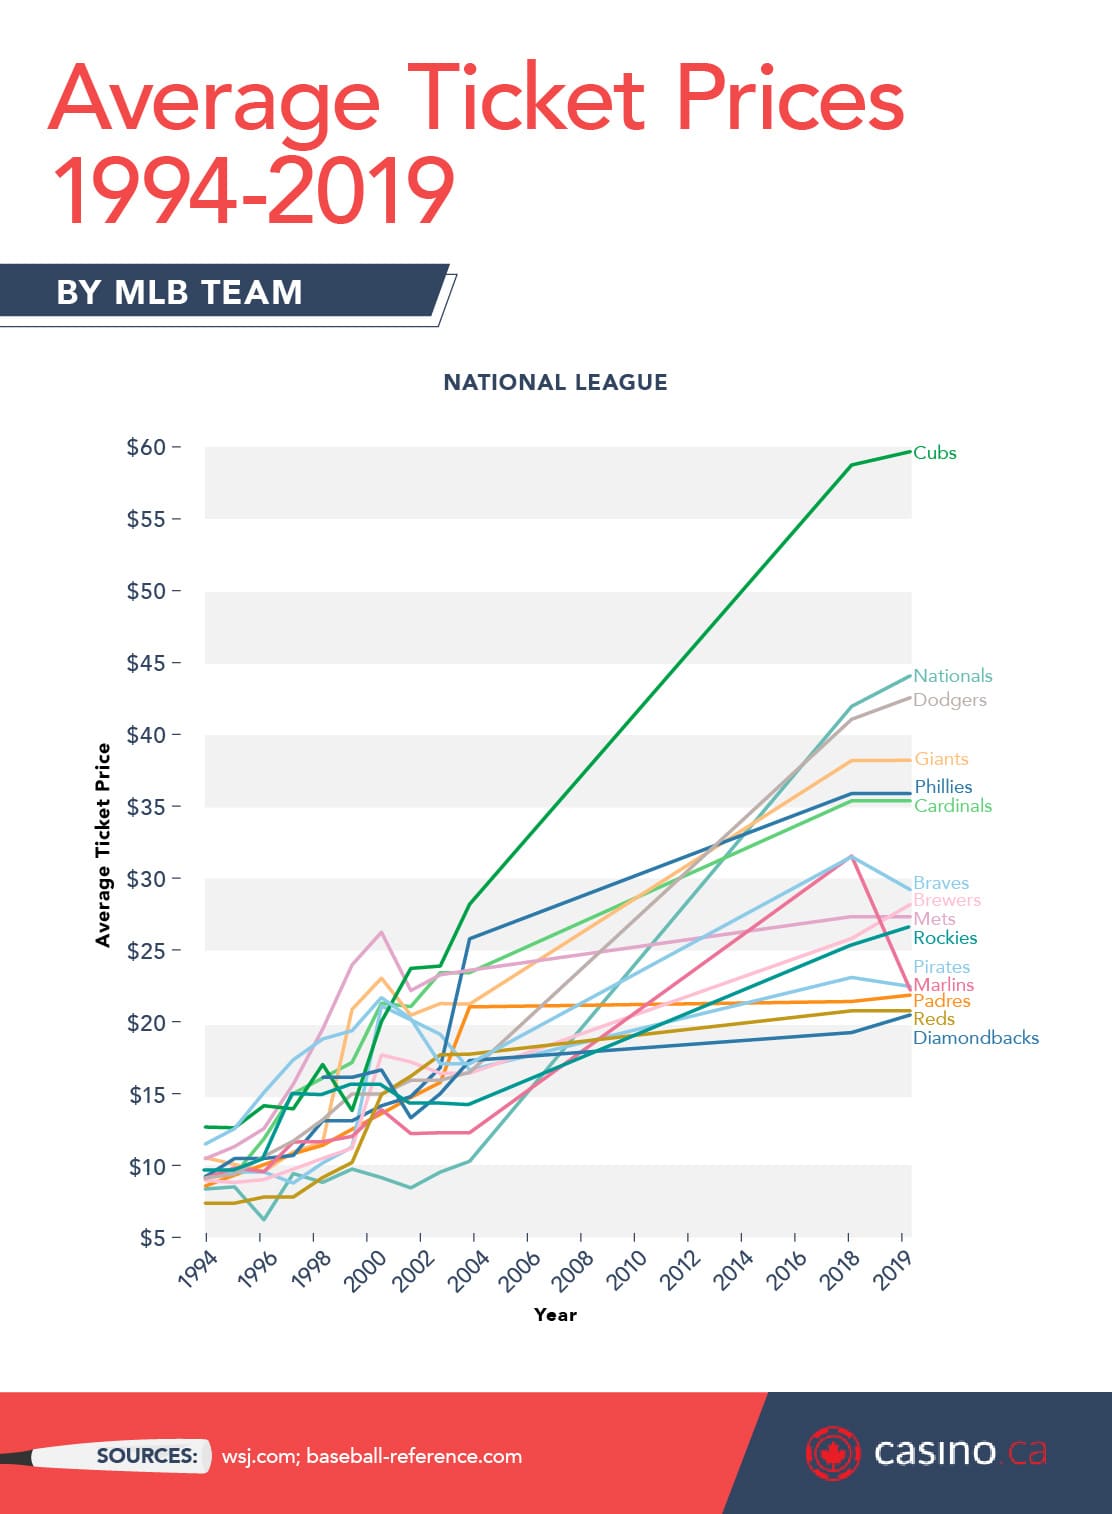
When you charge the highest rates in the game, you’d damn well better have the product to back it up. In the Cubs’ case, it’s more than just being more expensive or adjusting for inflation. If this was a class being grading on a curve, everyone else would hate the Cubs for absolutely blowing the whole thing up. And it’s been that way for the last 15 years or so.
The escalation began in earnest back in 1999, when the Cubs were right around the middle of the pack after a sharp decrease from the previous season’s average. They were up to the most expensive in the NL by 2002 and never looked back, maintaining a healthy lead for nearly 20 years now. While the Nationals and Dodgers have very similar trends, their starting points were much lower.
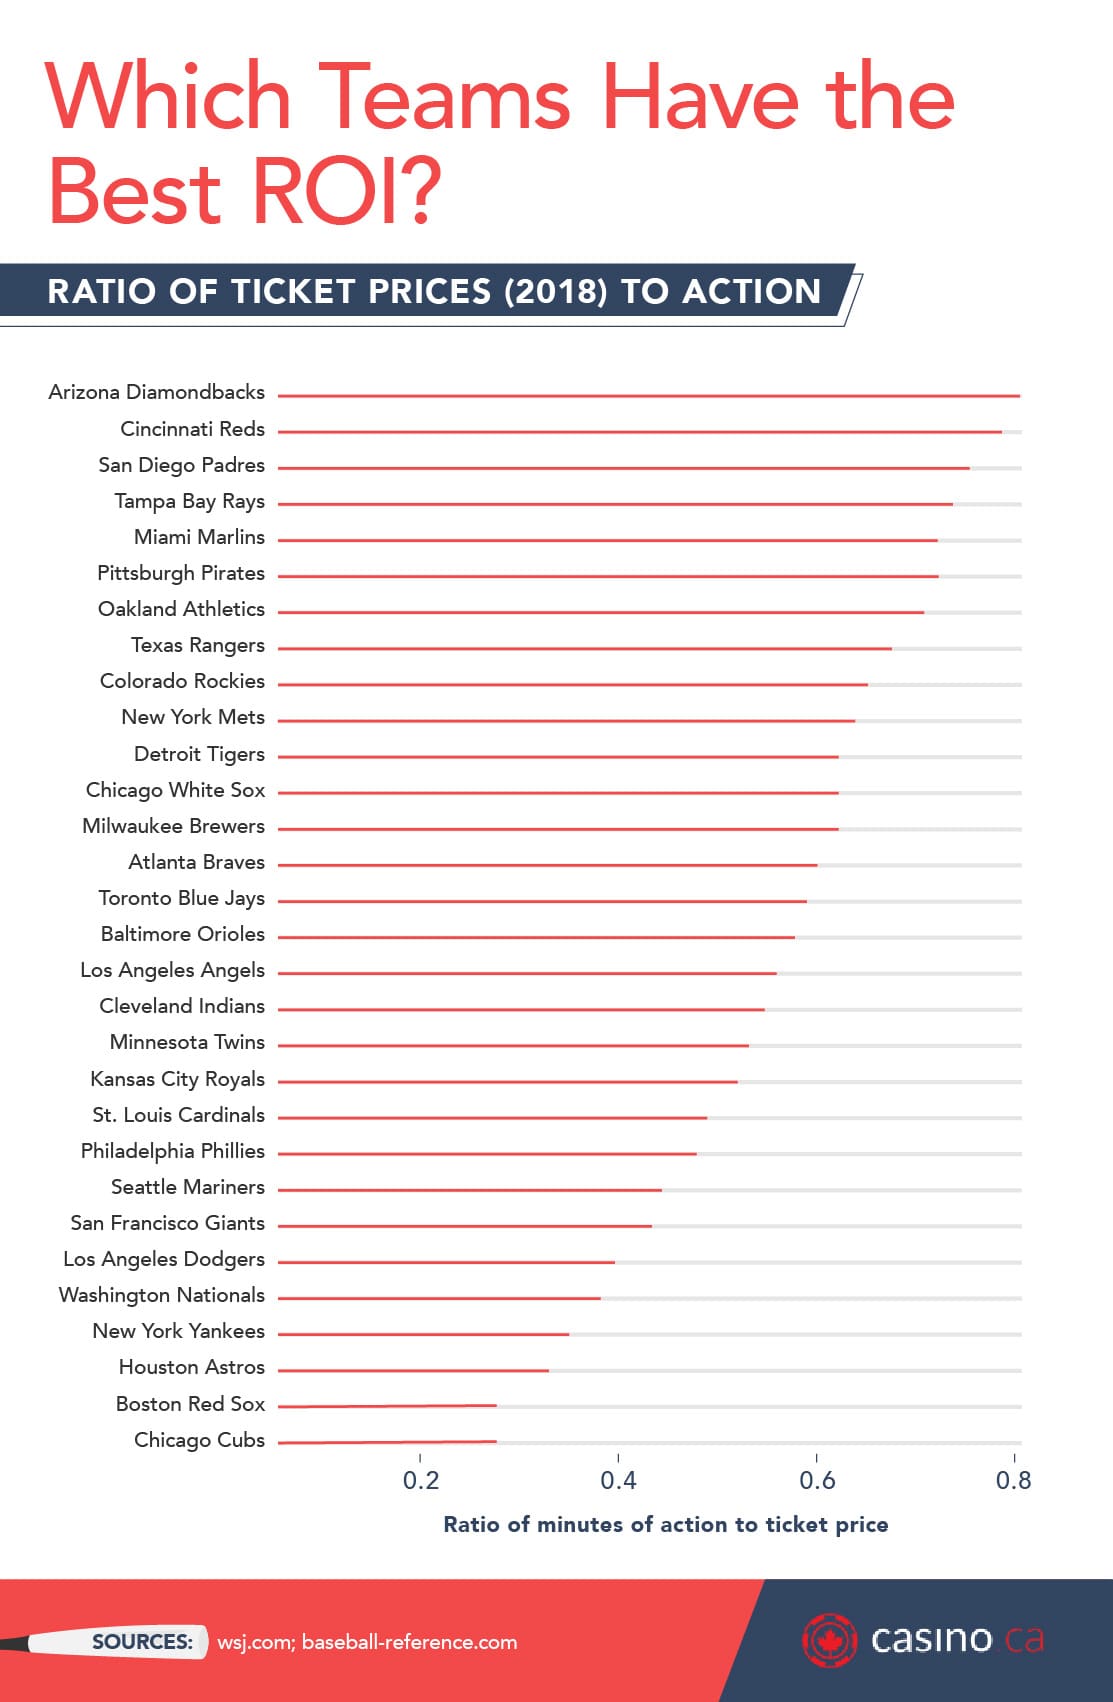
So we’ve established that the Cubs haven’t played the most exciting brand of baseball over the last handful of years, while at the same time boasting the highest ticket prices in the league. I don’t think I have to spend much time explaining to you what that means in terms of ROI for fans, do I? Okay, good, because I’m not very good at that stuff.
Based on the ratio of game action to ticket price, the Cubs are actually dead last in MLB with the Red Sox right there. It should be noted, however, that the teams at the bottom of the list are among the biggest markets in the sport and have all experienced a significant degree of success over the last few years. Those factors are going to naturally influence cost, so keep that in mind.
You should also keep in mind that the Cubs are the only team from among the bottom four on this list to have won a legitimate World Series since 2013.
What this study neglects to consider, understandably so, is that you can’t put a price on an experience. That’s exactly what a trip to Wrigley Field is for most people, even those who’ve been there for hundreds of games. There’s a reason the Cubs have been able to ride that steep price trend without falling off, and it ain’t because they’ve been successful the entire time.
You could say just about the same thing for the Red Sox, though their success came earlier and they’ve had much more of it over the last 25 years than have the Cubs. But they play in a venerable ballpark situated right in the middle of the action rather than floating in the middle of a parking-lot sea like some sort of anachronistic island.
There’s much more to a trip to Fenway or Wrigley than just the amount of action you see in one particular game, or even a string of games. The intrinsic value of those parks is simply higher than it is elsewhere, though winning certainly helps to justify those increasing costs. To that end, the Cubs had better get back to making playoff runs in order to either reverse the ROI numbers above or to at least ensure people are willing to forget about cost altogether.
You can check out the full article for even more charts and information, but I wanted to include the following on the methodology and limitations of the study for the sake of posterity.
Initial data visualization and exploration were done in R, using the ggplot2 and dplyr packages. The map of ticket prices was created with leaflet and hosted as a shiny app. For data on lengths of action, we used Wall Street Journal studies from 2010 and 2013, accessed via the National Arms Race blog. Pricing data for the period 1950 to 2004 was scraped from Doug Pappas’s Business of Baseball blog and price data for 2017 was scraped from UC Berkeley data science but was originally from Team Marketing Report, a service which is currently behind a paywall. We supplemented this with data from Baseball Reference, fetched via the baseballr R package, and from the Lahman baseball database, fetched via the Lahman R package.
Most of the data were programmatically manipulated via dplyr with work and data available on the Github repo. Since several teams have been introduced to the MLB or have changed their location and name since 1950, we updated latitude, longitude, and team names according to the Wikipedia Timeline of MLB History for the map of ticket prices.