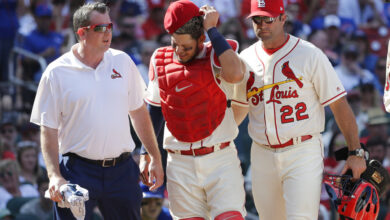
Making a Case for Optimism Regarding Matt Chapman’s Offense
It’s all about results at the end of the day, so there’s reason to eschew peripheral data in favor of box score numbers when the latter outdoes the former over a large enough sample. That’s why plenty of people are quick to dismiss Cody Bellinger’s 22nd-percentile average exit velocity (87.9 mph) and 10th-percentile hard-hit rate (31.4%) in light of 134 wRC+ and 26 homers with an immaculate two-strike approach. It’s also why just as many people are flying red flags when talking about Matt Chapman’s long-term prognosis as a hitter.
These two players aren’t just potential Cubs targets, they’re fascinating studies in contrast. Buoyed by a strong first half in which he hit 12 homers with a 123 wRC+, Chapman finished with 17 homers and a 110 wRC+ as his power deserted him in August. He landed on the IL with a right middle finger sprain late that month and bounced back to an extent in September, but his season on the whole was pretty up-and-down.
Of course, that’s not the interesting part.
Chapman finished with a 98th-percentile average exit velo (93.4 mph) and 100th-percentile hard-hit rate (56.4%), plus he had a 98th-percentile barrel rate (17.1%). Bellinger’s 6.1% in that latter category landed him in the 27th percentile, just for the sake of keeping everything even. These data points illustrate two wholly disparate hitters, but what if I told you each had an identical .319 BABIP.
The key here is that Bellinger’s 38% sweet-spot rate — the frequency with which he produced a batted-ball event with a launch angle ranging from 8-32 degrees — was worlds better than Chapman’s 32.4% mark. Bellinger was in the 86th percentile there while Chapman was in the 28th. Both had groundball rates in the 35-36% range, but Bellinger hit liners at nearly 21% while Chapman was under 16% on the season.
That means Chapman was getting the ball in the air more frequently, perhaps too much so. Or at least at too steep an angle with more frequency than was effective. While that approach wouldn’t have played well at Wrigley with the wind blowing in and knocking down lots of high flies, Statcast says he’d have hit 35 homers — seven more than in any other park — playing all of his games in Cincinnati. Milwaukee was tied with Atlanta for second.
Those two NL Central locations are among the most favorable for Chapman over the course of his career, and Wrigley also sets up well for him historically. With a small swing adjustment to convert some of those fly balls and/or grounders to line drives, we could be looking at a hitter who continues to live around or even above his career 118 wRC+ (120 through 2022).
Between the elite glove at third and offensive production that should remain mildly above-average even with additional regression, Chapman is a solid fit for the Cubs. Solid enough to commit $125 million or more for the next 5-6 years? That’s another story, one that doesn’t sound nearly as exciting if it’s not accompanied by several other moves.
As for Bellinger, I’ve gone on record more than once expressing concerns for how his performance will age under what figures to be a much bigger deal than Chapman will get. He was able to overcome his anemic peripherals this past season, I just don’t know how sustainable that is over 8-10 years. No one is paying $300 million for a guy whose power they believe will be gone in his early 30s.
I’m concerned about Chapman as well because he’s a couple years older and his value could drop like a rock if his glove falters. Both guys carry plenty of risk, so for me it comes down to the size of the investment and the faith in stronger batted-ball results to keep Chapman from falling off.

